
cas/definition/feature.php (core concept)
Power Laws
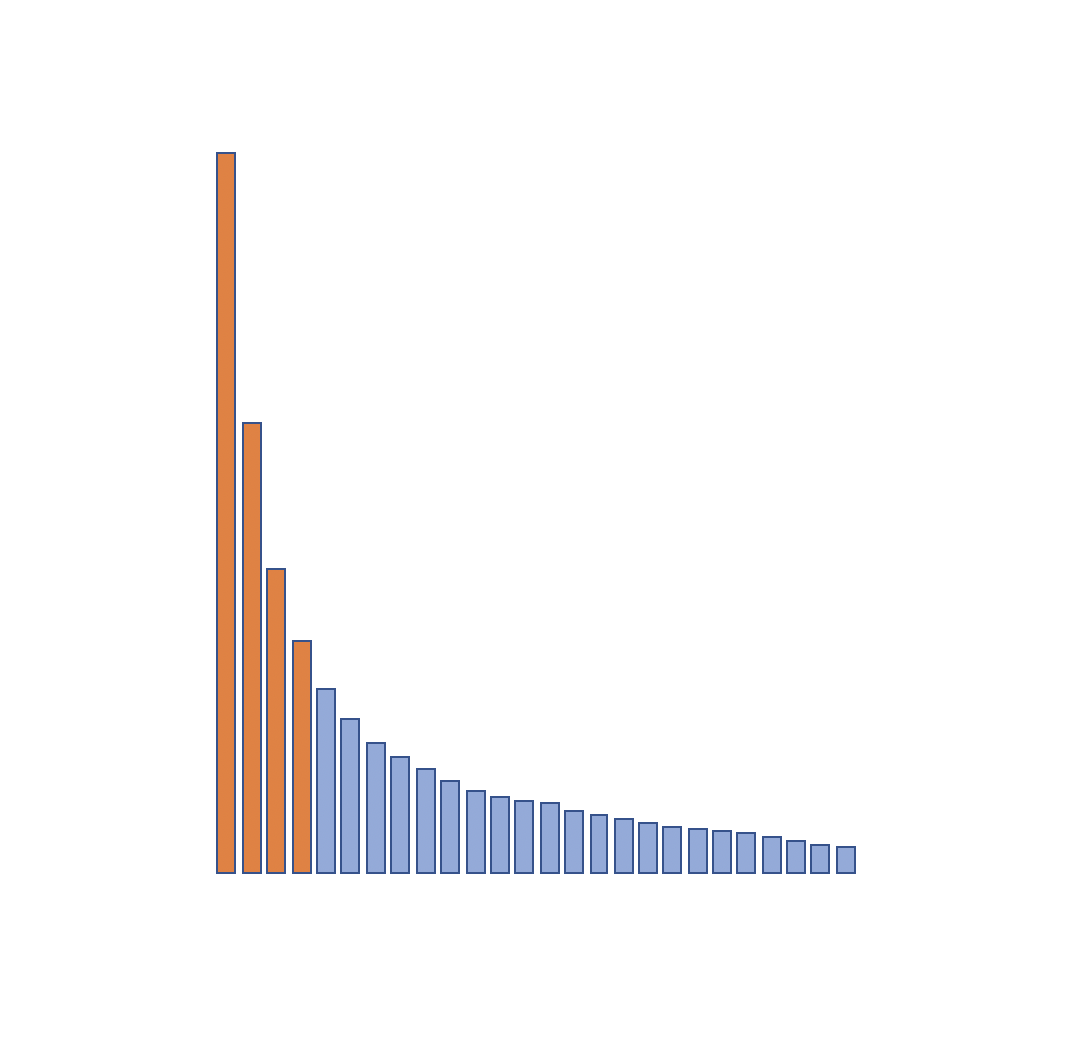
Complex System behaviors often exhibit power-laws: with a small number of system features wielding a large amount of system impact.
Power laws are particular mathematical distributions that appear in contexts where a very small number of system events or entities exist that, while rare, are highly impactful, alongside of a very large number of system events or entities exist that, while plentiful, have very little impact.
Power laws arise in both natural and social system, in contexts as diverse as earthquake intensities, city population sizes, and word frequency use.
'Normal' vs 'Power Law' Distributions
Complex systems are often characterized by power law distributions. A power law is a kind of mathematical distribution that we see in many different kinds of systems. It has different properties from the well known 'bell curve' 'normal' or 'Gaussian' distribution.
Let's look at the two here:
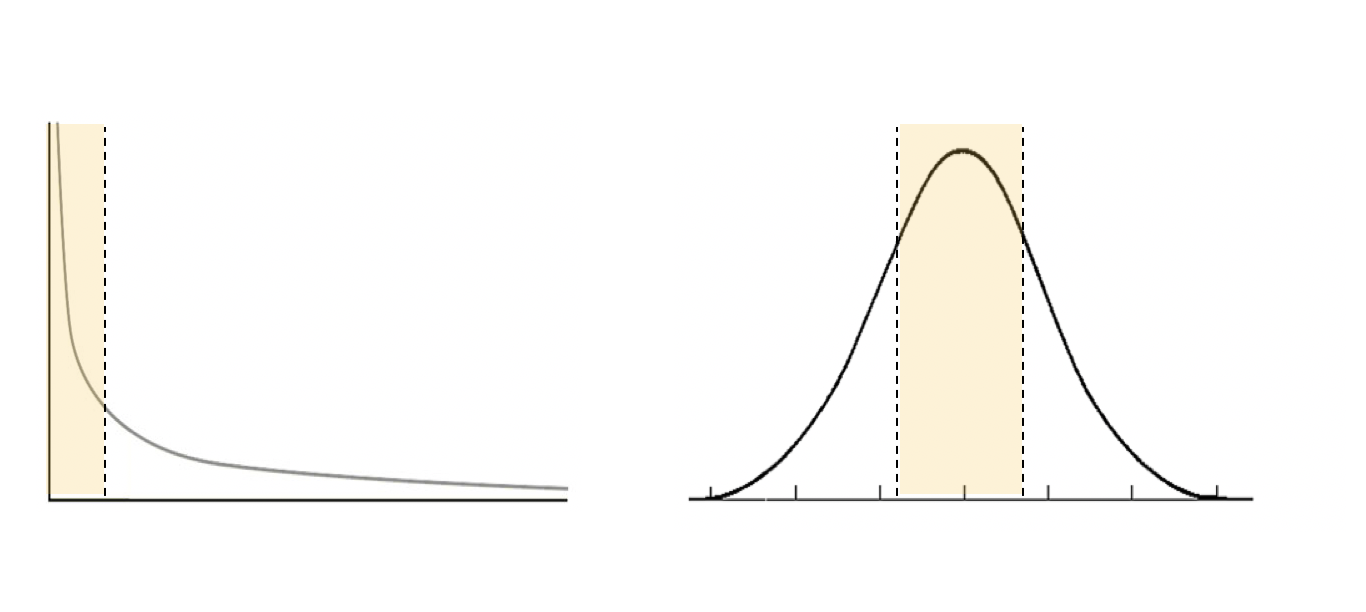
Power-law (left) vs Bell-curve (right)
Most people likely remember the bell curve from high school. The fat middle (highlighted) is the 'norm' and the two sides or edges represent the extremes. Accordingly, a bell curve can illustrate things like people's heights - with 'typical' heights being distributed around a large cluster at the middle, and extreme heights (both very tall and very short people), being represented by much smaller numbers at the extremes. There are many, many, phenomena that can be graphed using a bell curve. It is suitable for depicting systems that hover around a normative 'middle' and for systems where there are no driving correlations amongst members of the set. That is to say: the height of one person in classroom is not constrained or affected by heights of other people.
Power-law distributions are likely as common as bell-curve distributions, but for some reason people are not as familiar with them. They occur in systems where there is no normative middle where most phenomena occur. Furthermore, entities within a power-law set enjoy some kind of calibration feedback relation amongst them - meaning that the size of one entity in the system is in someway correlated with, (or has an impact) on the size and frequency of other entities. These systems are characterized by a small percent of phenomena or entities in the system, accounting for a great deal of influence or system impact.
This small percent is shown on the far left hand side of the diagram (highlighted), where the 'y' axis (vertical) indicates intensity or impact (of some phenomena), and the 'x' axis indicates the frequency of events, actors, or components associated with the impact. The left hand side of the diagram is sometimes called the 'fat head', and as we move along to the right hand side of the diagram, we see what is called 'the long tail'. Like the bell curve, which we can use to chart phenomena such as housing prices, heights, test scores, or household water consumption, the power law distribution can illustrate many different kinds of things.
Occasionally, we can illustrate the same phenomena using bell curves and power law distributions, while simultaneously highlighting different aspects of the same phenomena.
Example:
Let's say we chart income levels on a bell curve. The majority of people earn a moderate income, and a smaller number of people earn both very high and the very low incomes at the extreme sides. Showing this data, we get a chart that looks like the one below:
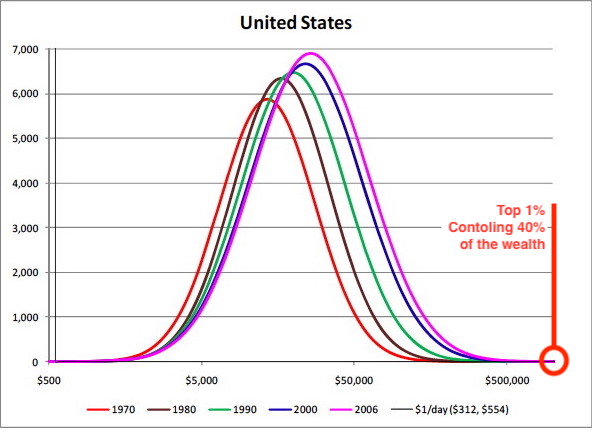
Wealth in the USA plotted as a bell curve (source: pseudoerasmus)
But, we can think of income distribution another way - the impact or intensity of incomes. Consider this fact of wealth distribution: in the US, if we look at the right side of the bell curve above (the wealthiest people who make up a small fraction or 1% of the population) these few people control around 45% of entire US wealth. Clearly, the bell curve does not capture the importance of this small fraction of extreme wealth holders.
Imagine that instead of plotting the number of people in different income brackets we were to instead plot the intensities of incomes themselves. In this case we would generate a plot showing:
- 1% (a few people) controlling 45% (a large chunk) of total wealth;
- 19% (a moderate number of people) controlling 35% ( a moderate chunk) of total wealth;
- 80% (the bulk of the population) controlling 20% (a small fraction) to total wealth.
These ratios plot as a power law, with approximately 20% of the people controlling 80% of the wealth resource.
80/20 Rule
These numbers, while not precisely aligning with US statistics, are not that far off, and they align with what is referred to as the '80/20' rule: where 20 percent of a system's components are responsible for 80 percent of the system's key functions or impacts. This phenomena was first noted by Vilfredo Pareto, and is also referred to as a a Pareto Distribution. We can find Pareto distributions in many different kinds of phenomena where the distributions might be applied to aspects such as - quantities, frequencies, or intensities. Thus:
- 20% of our wardrobe is worn 80% of the time;
- 20% of all English words are used 80% of the time;
- 20% of all roads attract 80% of all traffic;
- 20% of all grocery items account for 80% of all grocery sales;
Finally, if we smash a frozen potato against a wall and sort out the resulting broken chunks:
- 20% of the potato chunks will account for 80% of the total smashed potato.
Such ratios are so common that if you are unsure of a statistic then - provided it follows the 80/20 rule - you are likely safe to make it up! (the frozen potato being a case in point :))
Source: themediaconsortium.org
Rank Order
Another way to help understand how power law distributions work is to consider systems in terms of what is called their 'rank order'. We can illustrate this with language. Consider a few words from English:
- 'The' is the most commonly used word in the English language -
- We rank it 'first' and it accounts for 7% of all word use (rank 1) .
- "Of" is the second most commonly used word -
- We rank it 'second' and it accounts for 3.5% of all word use (1/2 of the rank 1 word)
If we were to continues, say looking at the 7th most frequently used word, we would expect to see it use 1/7th as frequently as the most commonly used word. And in fact -
- 'For' is the seventh most commonly word,
- We rank it seventh and it accounts for 1% of all word use (1/7 of the rank 1).
This power-law phenomena is known as 'Zipf's Law' for George Kingsley Zipf, the man who first identified it. Zipf's law indicates that if, for example, you have 100 items in a group, the 99th item will occur 1/99th as frequently as the first item. For any element in the group, you simply need to know its rank in the order - 1st, 3rd, 25th - to understand its frequency (relative to the top ranked item in the group).
The constant in Zipf's law is '1/n' , where the 'nth' ranked word in a list is used 1/nth as often as the most popular word.
Were all power-laws to follow a Zipf's law then:
- the 20th largest city would be 1/20th the size of the largest;
- the 10th most popular child's name would be used 1/10 of the time compared to the most popular;
- the 3rd largest earthquake in California in 100 years would be 1/3 of the size of the largest;
- the 50th most popular product would sell 1/50th as often as the most popular .
This is a very easy and neat set, and it is represents perhaps the most straightforward power law. That said, there can be other power law ratios between elements which, - while remaining constant, are not always such a 'clean' constant. These follow the same principle but are just more difficult to express (and calculate). For example"
'1.07/n' would be a power-law where the 'nth' ranked word in a list is used 1/1.07 times as often as the most popular word.
Pretty in Pink
Clearly '1.07/f' is a less satisfactory ratio then 1/n. In fact, the 1/n ratio is so pleasing that it has a few different names. 1/n is mathematically equivalent to 1/f ratio where, but instead of highlighting the rank in the list, 1/f highlights the frequency of an element in a list (the format is different but the meaning is the same).
'1/f' is also described as 'pink noise' - which is a statistical pattern distinct from 'brown' or 'white' noise. Each class of 'noise' pertains to different kinds of randomness in a system. In other words, while many systems exhibit random behaviors, some random behaviors differ from others. We can think of 'pink', 'white', and 'brownian', noise as being different 'flavors' of randomness. Without getting into too much detail here, 1/f noise seems to occur frequently in natural systems, and can be associated with beauty. In non-mathematical terms, pink noise involves a frequency ratio of component distributions such that there is just enough correlation between elements to provide a sense of unity, and just enough unexpectedness to provide variety. The human mind seems to enjoy this balance between the two, which is why pink noise can be found in music or artworks that we find beautiful. White noise is too random (no correlation) and brownian noise is too correlated (no unexpected interested).
Dynamics generating Power-laws
Power laws distributions have been identified in many complex system behaviors, such as:
- earthquake size and frequency
- neuron activity
- stock prices
- web site popularity
- academic citation network structure
- city sizes
- word use frequency
- ....and much more!
Much time and energy has gone into identifying where these distributions occur and also trying to understand why they occur.
Growing Riches
A strong contender for the presence of power-law dynamics is that they may be present in systems that involve both growth and Preferential Attachment. Understood colloquially as 'the rich get richer', preferential attachment is the idea is that popular things tend to attract more attention, thereby becoming more popular. Similarly, wealth begets wealth. The idea of growth and preferential attachment is therefore associated with positive feedback. It can be used to explain the presence of power-law distributions in the size and number of cities (bigger cities attract more industry thereby attracting more people...) the distributions of citations in academic publishing (highly cited authors are read more thereby attracting more citations), and the accumulation of wealth (rich people can make more investments, thereby attracting more wealth).
Push forward and Push back
Further, power-laws might be understood as a phenomena that occur in systems that involve both positive and negative feedback interactions as co-evolving drivers of the entities within the system. Such systems would involve feedback dynamics that are out of balance: some feedback dynamics (Positive Feedback) are amplifying certain system features, while others system dynamics (Negative Feedback) are simultaneously 'dampening' or constraining these same system features. Simultaneously there is a correlation between these push and pull dynamics - so the greater the push forward the more it generates a pull back, and vice versa. The imbalance between this push and pull interplay between interacting forces creates feedback loops that lead to power-law features.
An example of this would be that of reproducing species in an eco-system with limited carrying capacity. Plentiful food would tend to amplify reproduction and survival rates (positive feedback), but as population expands this begins to put pressure on the food resources, leading to a push back (lower survival rates), and consequently a drop in population levels. The two driving factors in the system - growing population and dwindling food - are causally intertwined with one another and are not necessarily in balance. If the system achieves a perfect balance then the system will find an equilibrium - the reproduction rate will settle to a point where it matches the carrying capacity. But if there are forces that drive the system out of balance, or if there is a lag time between how the two 'push' and 'pull' (amplifying and constraining) dynamics interact, then the system cannot reach equilibrium and instead keeps oscillating between states (see Bifurcations ).
Example: What's in a Name?
It has been shown that the frequency of baby name occurrences follows a power-law distribution. In this example, what is the push/pull interplay that might lead to the emergence of this regularity?
While each set of parents chooses their child's name independently, they do so within a system where their choices are somewhat driven or constrained by the choices being made by parents around them. Suppose there is a name that, for some reason, has become prevalent in popular consciousness - perhaps a character name in a popular book or tv series. It is not necessary to know the precise reasons why this particular name becomes popular, but we can imagine that certain names seem to resonate in popular consciousness or 'the zeitgeist'. Let us take the name 'Jennifer'. An obscure name in the 1930s, it became the most popular girl's name in the 1970s. During that time, if you were one of the approximately 16 million girls born in the US, there was a 2.8% chance you would be named Jennifer! And yet, the name had plummeted back to 1940s levels by the time we get to 2012.
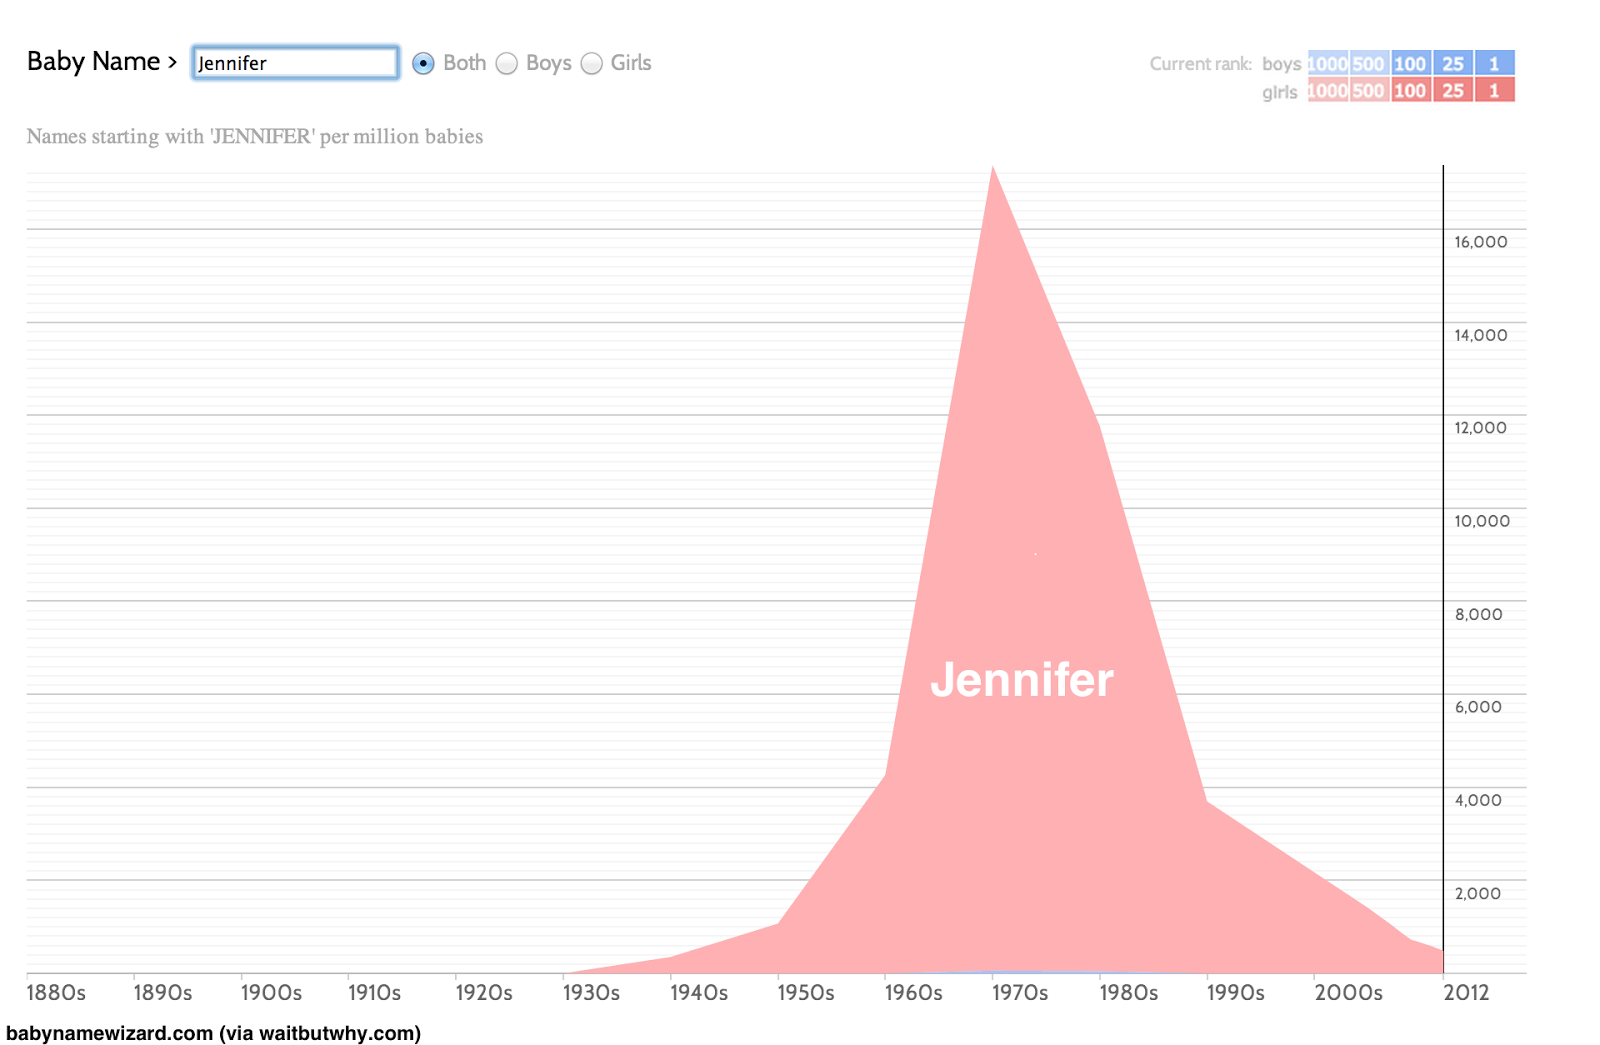
the rise and fall of Jennifer
But how can the rise and fall of 'Jennifer' be described using push and pull forces? We can imagine a popular name being like a contagion, where a given name catches on in popular consciousness. During its initial spread, the name is highlighted even further in popular consciousness, potentially expanding its appeal. At the same time, the very fact that the name is popular causes a tendency for resistance - if Jennifer is on a short list of possible baby names, but a sibling or close friend names their child 'Jennifer', this has an impact on your naming choice. In fact, the more popular the name becomes, the more pullback we can expect. As more and more people tap into the popularity of a name, it becomes more and more commonplace, leading to a sense of overuse, leading to a search for new novelty. The interactions of push and pull cause the name to both rise and fall. In a system of names, Jennifer is a name that had an expansion rate caused by rising popularity feedback, but then a decay rate caused by overuse and loss of freshness.
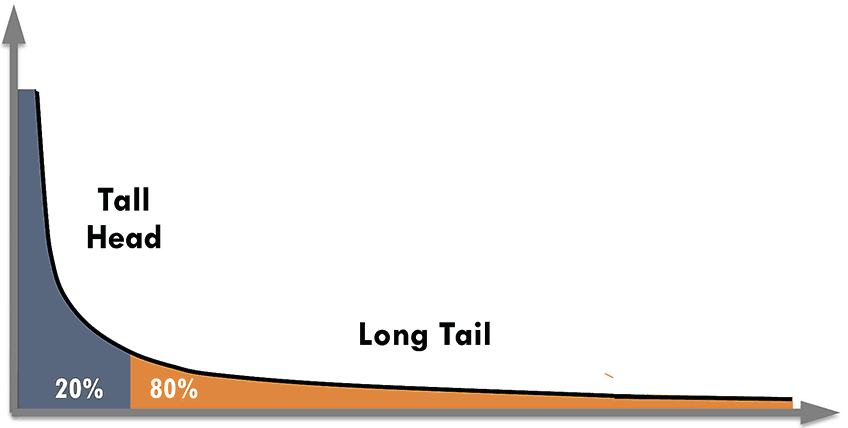
The Long Tail
An additional feature of power law distribution that should not be overlooked is what is sometimes called the "power of the long tail". While power law systems have a few strongly performing elements in the upper 20%, there are still many important actors in the remaining 80% of the distribution. One recent feature of information technologies is that it is easier to "find" the specificity of this 80%. If we think about bookstores from only a decade ago, they needed to carry only the "best-sellers": if your reading interests fell outside of the norm than it would be difficult to find books that would serve as the right "fit" or "niche" for your reading interests. Today, with information flows having become so inexpensive, online bookstores are not limited by the number of titles they can carry, so people can find the niche books they actually want to read rather than having to compromise around the average. In some ways this echoes eco-systems, where there can be a few top players, but where there also exist many viable micro-niches that can be populated. There are many domains where accessing this "long tail" will lead to more choice and precision in complex systems.
Proviso
While power-laws are often pointed to as 'the fingerprint of complexity', It should. be noted that their recent ubiquity is not without controversy. While many studies highlight the presence of these mathematical regularities in a host of diverse systems, other argue that the statistics upon which these findings are based are often skewed, and that power-laws may not be as common in systems as is frequently stated. It is a problem of researchers looking to affirm the existence of these patterns that may cause them to ignore results where they do not occur, and attribute their presence in systems that may or may not actually hold these properties.
Back to Core Concepts
Back to Navigating Complexity
Cite this page:
Wohl, S. (2022, 8 June). Power Laws. Retrieved from https://kapalicarsi.wittmeyer.io/definition/power-laws
Power Laws was updated June 8th, 2022.
Nothing over here yet
This is the feed, a series of related links and resources. Add a link to the feed →
Nothing in the feed...yet.
This is a list of People that Power Laws is related to.
power law distributions + Pareto optimality
Outlined the 'Pareto distribution' power law - known as the 80/20 rule: whereby 20% of the system is responsible for 80% of the impact.
Learn more →Scaling | Criticality | Power Laws
'Fingerprint of complexity' extraction plunger pot, bar single shot froth eu shop latte et, chicory, steamed seasonal grounds dark organic.
Learn more →Logistic Map
This is a default subtitle for this page. Learn more →Urban Computational Modeling
Mike Batty is one of the key contributors to modeling cities as Complex Adaptive Systems
Learn more →
City Scaling
This is a default subtitle for this page. Learn more →Power Laws
This is a default subtitle for this page. Learn more →This is a list of Terms that Power Laws is related to.
..or the rich get richer!
Think of preferential attachment as an attribute of when 'the rich get richer' within a networked system. This occurs when nodes that have a lot of links tend to attract more links as other nodes enter the system resulting in super-nodes. Learn more →Positive Feedback serves to amplify particular behaviors, such that a small change in initial conditions can engender a large change in overall system behavior over the course of time.
This is a default subtitle for this page. Learn more →Relates to {{Relational-Geography}} and {{Landscape-Urbanism}}
In geography there has been a move away from thinking about space as a "thing" and to instead think about how different places exist due to how they interact with flows. Places that capture more flows, are more geographically relevant
Learn more →This is a list of Urban Fields that Power Laws is related to.
Many cities around the world self-build without top-down control. What do these processes have in common with complexity?
Cities around the world are growing without the capacity for top-down control. Informal urbanism is an example of bottom-up processes that shape the city. Can these processes be harnessed in ways that make them more effective and productive?
Increasingly, data is guiding how cities are built and managed. 'Datascapes' are both derived from our actions but then can also steer them. How do humans and data interact in complex ways?
More and more, the proliferation of data is leading to new opportunities in how we inhabit space. How might a data-steered environment operate as a complex system?
This is a list of Key Concepts that Power Laws is related to.
CAS tend to organize to a 'critical state' where, regardless of the scale of a given input, the scale of corresponding output observes of a power-law distribution.
Strike a match and drop it in the forest. How big will the resulting fire be? The forest is dry but not overly so... vegetation is relatively thick. Will the fire burn a few trees and then flame out, or will it jump from branch to branch, burning thousands of acres to the ground?
Learn more →
'Scale-free' networks are ones in which identical system structure is observed for any level of network magnification.
Complex systems tend towards scale-free, nested hierarchies. By 'Scale-free', we mean to say that we can zoom in on the system at any level of magnification, and observe the same kind of structural relations.
Learn more →Navigating Complexity © 2015-2026 Sharon Wohl, all rights reserved. Developed by Sean Wittmeyer
Sign In (SSO) | Sign In
Related (this page): Urban Modeling (11), Texts (5), Nested Orders (23), Self-Organized Criticality (64),
Section: concepts
Non-Linearity
Related (same section): Tipping Points (218, concepts), Path Dependency (93, concepts), Far From Equilibrium (212, concepts),
Related (all): Urban Modeling (11, fields), Resilient Urbanism (14, fields), Relational Geography (19, fields), Landscape Urbanism (15, fields), Evolutionary Geography (12, fields), Communicative Planning (18, fields), Assemblage Geography (20, fields),
Nested Orders
Related (same section): Self-Organized Criticality (64, concepts), Scale-Free (217, concepts), Power Laws (66, concepts),
Related (all): Urban Modeling (11, fields), Urban Informalities (16, fields), Resilient Urbanism (14, fields),
Emergence
Related (same section): Self-Organization (214, concepts), Fitness (59, concepts), Attractor States (72, concepts),
Related (all): Urban Modeling (11, fields), Urban Informalities (16, fields), Urban Datascapes (28, fields), Incremental Urbanism (13, fields), Evolutionary Geography (12, fields), Communicative Planning (18, fields), Assemblage Geography (20, fields),
Driving Flows
Related (same section): Open / Dissipative (84, concepts), Networks (75, concepts), Information (73, concepts),
Related (all): Urban Datascapes (28, fields), Tactical Urbanism (17, fields), Relational Geography (19, fields), Parametric Urbanism (10, fields), Landscape Urbanism (15, fields), Evolutionary Geography (12, fields), Communicative Planning (18, fields), Assemblage Geography (20, fields),
Bottom-up Agents
Related (same section): Rules (213, concepts), Iterations (56, concepts),
Related (all): Urban Modeling (11, fields), Urban Informalities (16, fields), Resilient Urbanism (14, fields), Parametric Urbanism (10, fields), Incremental Urbanism (13, fields), Evolutionary Geography (12, fields), Communicative Planning (18, fields),
Adaptive Capacity
Related (same section): Feedback (88, concepts), Degrees of Freedom (78, concepts),
Related (all): Urban Modeling (11, fields), Urban Informalities (16, fields), Tactical Urbanism (17, fields), Parametric Urbanism (10, fields), Landscape Urbanism (15, fields), Incremental Urbanism (13, fields), Evolutionary Geography (12, fields),