
cas/definition.php (people or term)
See also: Causal loop diagram - Wikipedia
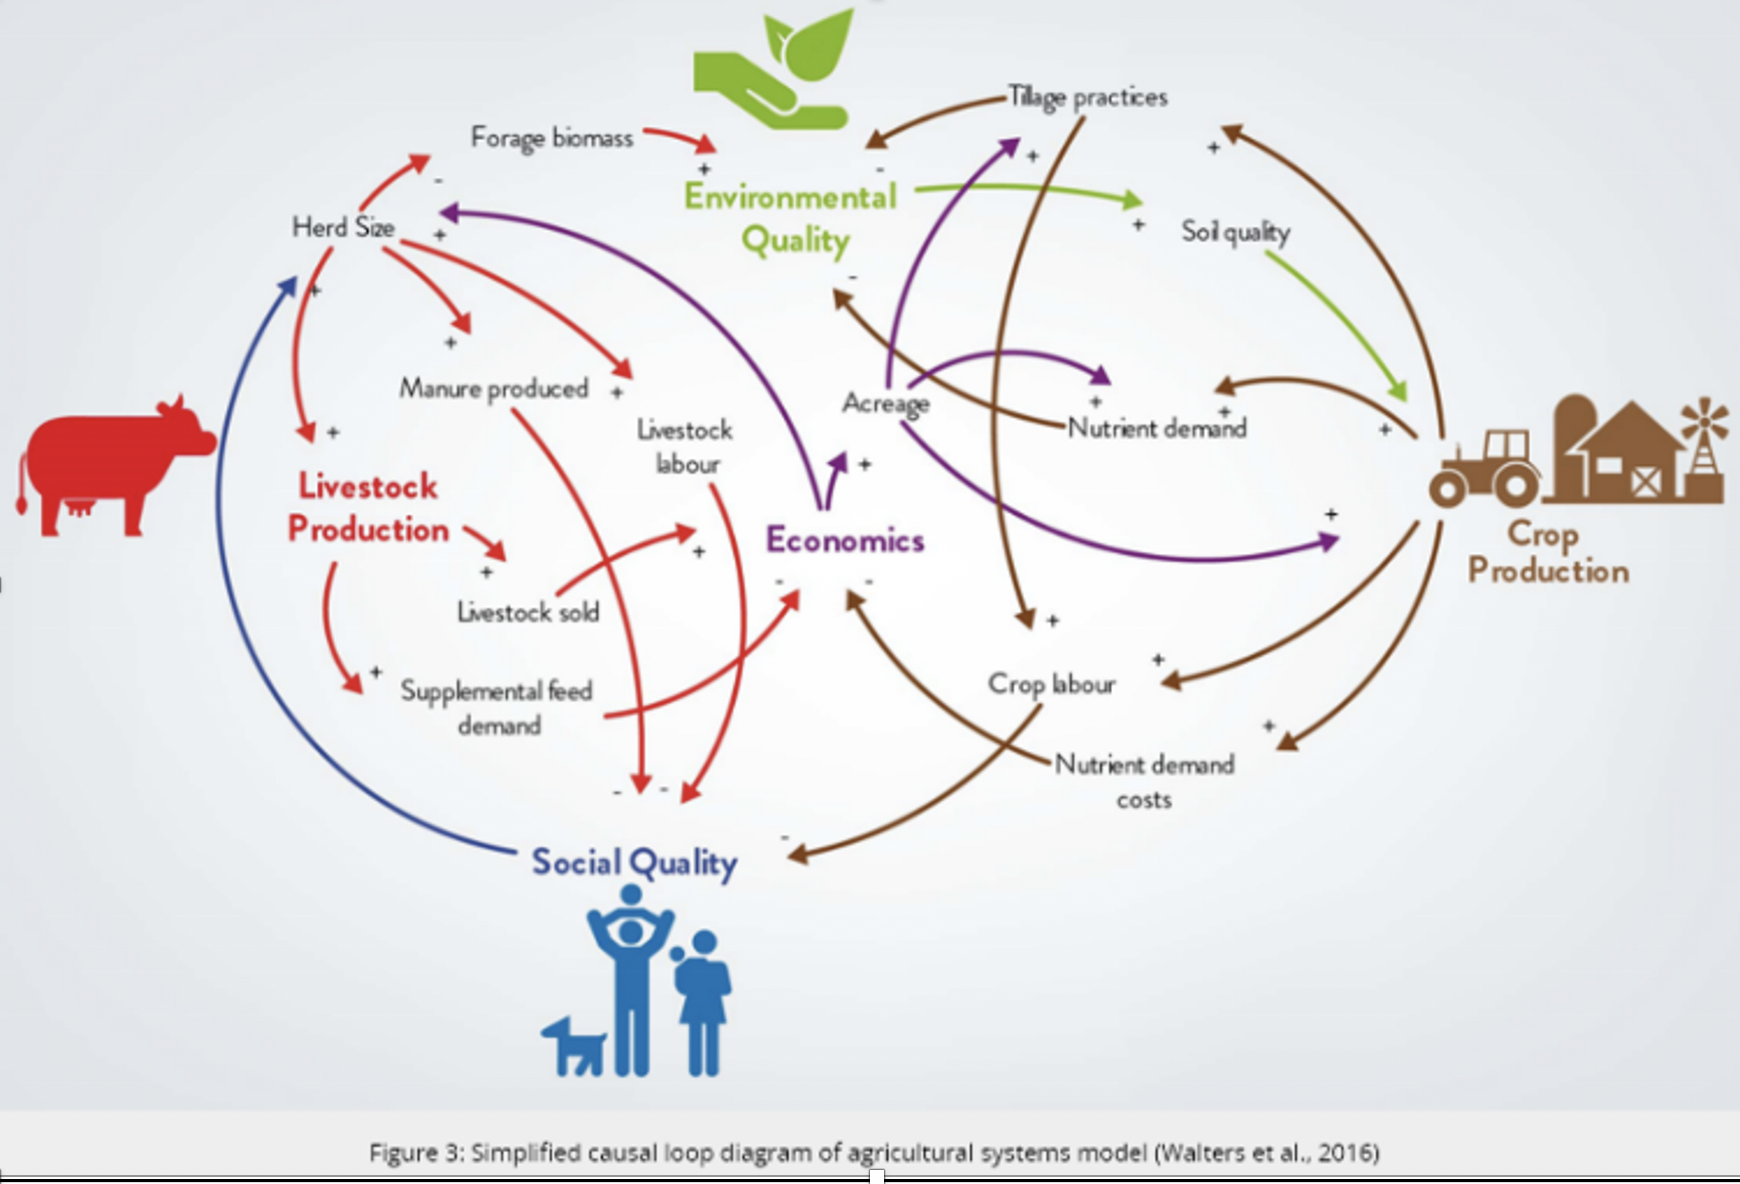
A causal loop diagram (CLD) is a theoretical account of how different Variables in a system are causally related. It obeys specific rules on how to represent those different relationships, namely, on positive and negative causal relationships, and it focuses on representing these Feedback dynamics.
A CLD is useful as a theoretical tool amongst policy makers to aid the process of compiling and discussing the most important agents in a system, and the dynamics that contribute to their evolution in a qualitative way. Often these diagrams can then be used as a tool to initiate the development of a quantitative model - such as a computer simulation model - but is a good first step for understanding the dynamics of a system with experts or stakeholdersnot directly involved with model development.
Strengths
It is relatively simple to read, and it highlights important feedbacks, facilitating discussion.
Weaknesses
It does not provide quantitative information of the behavior of a system; it may contain logically inconsistent information; it gets cluttered and hard to read as the model becomes more complex
Tools
Check out this free Online Tool for creating your own diagrams:

Example
This example shows a variety of causal variables impacting upon agricultural production - arrowheads indicate direction of causal chains.
See Also: Seewall Wright
contribution by...
Cite this page:
Wohl, S. (2022, 13 June). Causal Loop Diagrams. Retrieved from https://kapalicarsi.wittmeyer.io/definition/causal-loop-diagrams
Causal Loop Diagrams was updated June 13th, 2022.
Nothing over here yet
Navigating Complexity © 2015-2026 Sharon Wohl, all rights reserved. Developed by Sean Wittmeyer
Sign In (SSO) | Sign In
Related (this page):
Section: terms
Non-Linearity
Related (same section):
Related (all): Urban Modeling (11, fields), Resilient Urbanism (14, fields), Relational Geography (19, fields), Landscape Urbanism (15, fields), Evolutionary Geography (12, fields), Communicative Planning (18, fields), Assemblage Geography (20, fields), Tipping Points (218, concepts), Path Dependency (93, concepts), Far From Equilibrium (212, concepts),
Nested Orders
Related (same section):
Related (all): Urban Modeling (11, fields), Urban Informalities (16, fields), Resilient Urbanism (14, fields), Self-Organized Criticality (64, concepts), Scale-Free (217, concepts), Power Laws (66, concepts),
Emergence
Related (same section):
Related (all): Urban Modeling (11, fields), Urban Informalities (16, fields), Urban Datascapes (28, fields), Incremental Urbanism (13, fields), Evolutionary Geography (12, fields), Communicative Planning (18, fields), Assemblage Geography (20, fields), Self-Organization (214, concepts), Fitness (59, concepts), Attractor States (72, concepts),
Driving Flows
Related (same section):
Related (all): Urban Datascapes (28, fields), Tactical Urbanism (17, fields), Relational Geography (19, fields), Parametric Urbanism (10, fields), Landscape Urbanism (15, fields), Evolutionary Geography (12, fields), Communicative Planning (18, fields), Assemblage Geography (20, fields), Open / Dissipative (84, concepts), Networks (75, concepts), Information (73, concepts),
Bottom-up Agents
Related (same section):
Related (all): Urban Modeling (11, fields), Urban Informalities (16, fields), Resilient Urbanism (14, fields), Parametric Urbanism (10, fields), Incremental Urbanism (13, fields), Evolutionary Geography (12, fields), Communicative Planning (18, fields), Rules (213, concepts), Iterations (56, concepts),
Adaptive Capacity
Related (same section):
Related (all): Urban Modeling (11, fields), Urban Informalities (16, fields), Tactical Urbanism (17, fields), Parametric Urbanism (10, fields), Landscape Urbanism (15, fields), Incremental Urbanism (13, fields), Evolutionary Geography (12, fields), Feedback (88, concepts), Degrees of Freedom (78, concepts),